Data Analysis
The Key to Better Decision-Making
In today's rapidly evolving business landscape, staying ahead of the competition requires a strategic approach that maximizes efficiency and effectiveness.
Two Pillars of Business Optimization
Two essential pillars that can significantly impact business optimization are data analysis and process automation.
Data analysis
Data analysis can help businesses identify trends, patterns, and insights that can be used to improve efficiency, make better decisions, and increase profitability.
Process automation
Process automation is the use of technology to automate repetitive tasks. This can help businesses streamline operations, reduce costs, and improve customer service and can free up employees to focus on more strategic work and improve efficiency across the organization.
When combined, data analysis and process automation can create a powerful force for business growth. By utilizing the power of data and automating repetitive tasks, businesses can make well-informed decisions, streamline operations, and achieve remarkable optimization. As a result, the business will improve its productivity, Process, and Profit and achieve its goals.
What is Data Analysis?
Data analysis is the process of collecting, cleaning, and analyzing data to extract meaningful insights and trends.
This data can be used to make better decisions about everything from marketing campaigns to product development. However, without proper analysis, this data remains an untapped resource. By leveraging data analysis tools and techniques, companies can gain a deeper understanding of their operations, customers, and market trends.
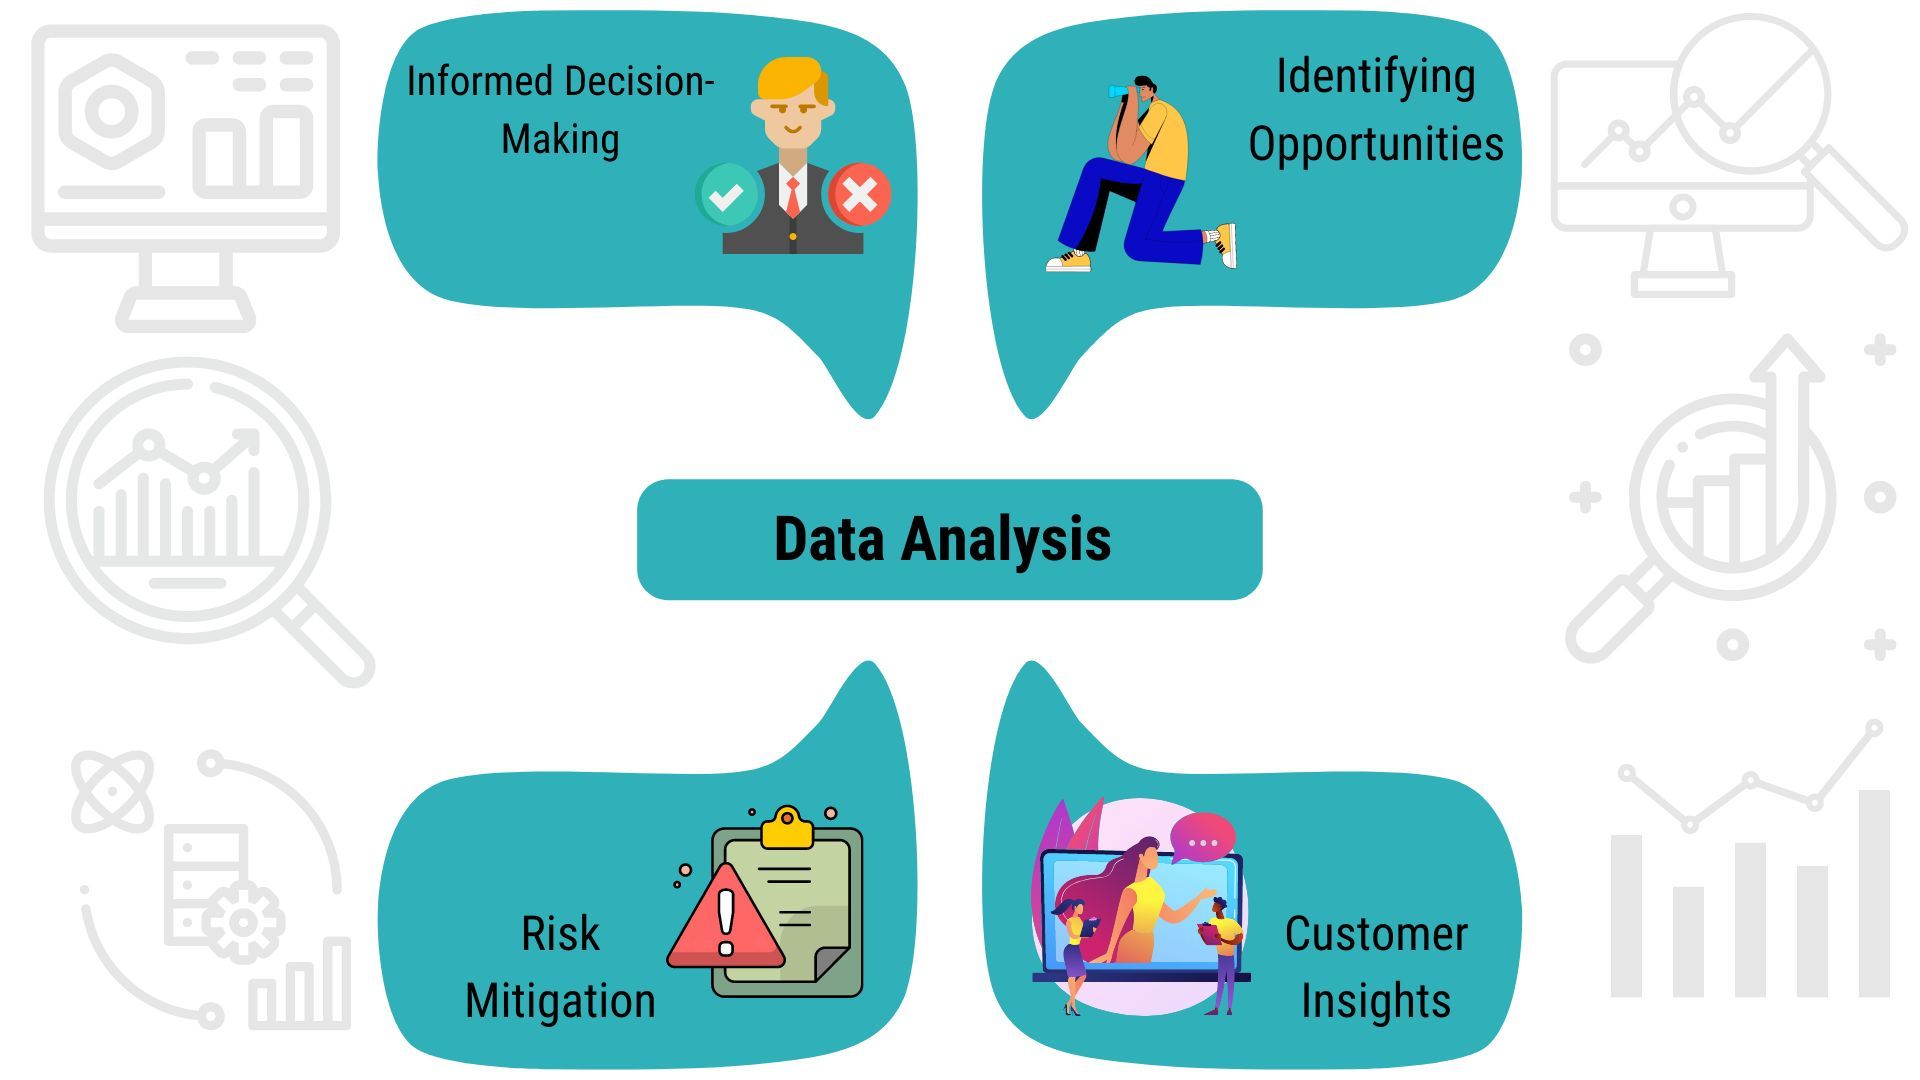
Benefits of Data Analysis in Business Optimization
Informed Decision-Making
Data-driven decisions are more accurate and less prone to biases. By analyzing historical data and real-time information, businesses can make informed choices that lead to better outcomes.
Identifying Opportunities
Data analysis helps identify untapped opportunities and areas for improvement. Whether it's recognizing new market segments or optimizing internal processes, data-driven insights can drive growth.
Customer Insights
Understanding customer behavior is crucial for any business. Data analysis allows for the creation of customer profiles and preferences, leading to more personalized and targeted marketing strategies.
Risk Mitigation
By analyzing historical data and patterns, businesses can identify potential risks and take proactive measures to mitigate them.
How Data Analysis Use in 10 Steps of Business Optimization
Data analysis is a key component of all steps of business optimization. It can help you identify areas for improvement, track progress, and make informed decisions about your business.
In our previous blog post, we discussed the 10 steps of business optimization. In this post, we will discuss the type of data analysis that can be used in each step.
Step 1 - Set clear goals
You can use data analysis to help you set clear goals. For example, you can use data to identify your target market, understand your competition, and track your progress toward your goals.
Market research
This type of data analysis can help you understand your target market, including their needs, wants, and demographics.
Competitive analysis
This type of data analysis can help you understand your competition, including their strengths, weaknesses, and strategies.
Performance tracking
This type of data analysis can help you track your progress toward your goals and make necessary adjustments.
By using data analysis in step 1, you can set clear goals that are based on data and are realistic and achievable.
Step 2 - Gather Analytics
You can use descriptive, diagnostic, and predictive data analysis to gather analytics. Descriptive data analysis is used to describe the data that you have collected. Diagnostic data analysis is used to identify the causes of problems. Predictive data analysis is used to predict future outcomes.
Website Traffic
You can use descriptive data analysis to see how many people are visiting your website, where they are coming from, and what pages they are viewing. You can use diagnostic data analysis to identify which pages are causing people to leave your website, and you can use predictive data analysis to predict how many people will visit your website in the future.
Social Media Engagement
You can use descriptive data analysis to see how many people engage with your content, what type of content gets the most engagement, and when people are most active on social media. You can use diagnostic data analysis to identify which posts are getting the most engagement, and you can use predictive data analysis to predict how many people will engage with your content in the future.
Sales
You can use descriptive data analysis to see how many products you are selling, how much money you are making, and which products are selling the best. You can use diagnostic data analysis to identify which products are not selling well, and you can use predictive data analysis to predict how much money you will make in the future.
Descriptive analytics use to answer questions such as:
- What is the average number of website visitors per day?
- What are the most popular social media channels for my business?
- What are my top-selling products?
This can be used to create reports and dashboards that can be used to track progress and make decisions.
Step 3 - Review Performance
You can use descriptive, diagnostic, and predictive data analysis to review your performance. Descriptive data analysis can help you identify areas where you are doing well and areas where you can improve. Diagnostic data analysis can help you understand why you are doing well or poorly in certain areas. Predictive data analysis can help you predict how you will perform in the future.
Here are some examples of data analysis that you can use in step 3:
Descriptive data analysis
You can use descriptive data analysis to track your progress over time. For example, you can track your sales, website traffic, or social media engagement. This will help you see how you are doing and identify areas where you can improve.
Diagnostic data analysis
You can use diagnostic data analysis to understand why you are doing well or poorly in certain areas. For example, you can use diagnostic data analysis to identify the factors that are driving your sales or website traffic. This will help you make changes to improve your performance.
Predictive data analysis
You can use predictive data analysis to predict how you will perform in the future. For example, you can use predictive data analysis to predict your sales or website traffic for the next month or quarter. This will help you make informed decisions about your business.
Time series analysis
Time series analysis is a type of data analysis that studies data collected over time. It can be used to identify trends, patterns, and relationships in data. For example, time series analysis can identify trends in sales, customer satisfaction, or even the weather.
The type of data analysis that you use will depend on the specific questions that you are trying to answer. For example, if you are trying to identify areas where you are doing well, you might use descriptive statistics to summarize your performance data. If you are trying to identify areas where you can improve, you might use inferential statistics to make inferences about your performance based on a sample of data.
Step 4 - Identify waste
You can use data analysis to identify waste. Many types of data analysis can be used to identify waste in processes, products, and services.
Common Types of Data Analysis
Statistical analysis
This type of analysis can be used to identify patterns and trends in data. For example, statistical analysis can be used to identify which steps in a process are taking the most time or which products are being returned the most often.
Process mining
This type of analysis can be used to track the flow of data and information through a process. This can help identify where waste is occurring in the process.
Value stream mapping
This type of analysis can be used to map out the steps involved in creating a product or service. This can help identify where waste is occurring in the value chain.
Six Sigma
This is a methodology that uses data and statistical analysis to improve quality and reduce waste.
The specific type of data analysis that is used will depend on the specific process, product, or service that is being analyzed.
Step 5 - Eliminate waste
You can use data analysis to eliminate waste. This includes implementing changes to your processes, products, and services to remove waste.
The following are some types of data analysis that can be used to eliminate waste in step 5 of the lean process:
Process analysis
This type of analysis looks at the steps in a process to identify where waste is occurring. For example, a process analysis might identify that a step in the process is taking too long, or that there is a lot of waiting time between steps.
Value stream mapping
This type of analysis maps the flow of materials and information through a process to identify where waste occurs. For example, a value stream map might identify that there are a lot of steps in the process that do not add value to the product or service or that there are a lot of handoffs between steps.
Root cause analysis
This type of analysis looks at the underlying causes of waste to identify solutions. For example, a root cause analysis might identify that the reason a step in the process is taking too long is that the equipment is not working properly.
Statistical process control
This type of analysis uses data to identify and control variation in a process. For example, statistical process control might identify that the quality of a product is not meeting specifications because the process is not being controlled properly.
Process mining
It can be used to identify bottlenecks and inefficiencies in manufacturing processes. This information can then be used to change the process that will eliminate the waste.
Design thinking
can be used to identify areas where products can be simplified or improved. This information can then be used to make changes to the product that will eliminate the waste.
By using data analysis to identify and eliminate waste, you can improve the efficiency and effectiveness of your processes. This can result in improved quality, reduced costs, and increased customer satisfaction.
Using data analysis to eliminate waste, organizations can improve efficiency, reduce costs, and improve quality.
Step 6 - Create Plans to Achieve Goals
You can use descriptive and predictive data analysis to create plans to achieve your goals.
Descriptive data analysis
It can be used to summarize and describe data. This can greatly assist in discerning trends and patterns in your data. For example, you could use descriptive data analysis to identify which products are selling the best or which customers are most likely to churn.
Predictive data analysis
Predictive data analysis can help you identify the steps you need to take to achieve your goals by analyzing data on past performance. For example, you could use descriptive data analysis to identify the demographics of your customers and then use predictive data analysis to predict how your customer base is likely to change in the future. This information could then be used to develop marketing plans that target the right customers with the right message.
Once you have identified the resources you need and the steps you need to take to achieve your goals, you can create a plan of action. A SMART plan is specific, achievable, measurable, relevant, and time-bound. It should also be flexible enough to be adapted as needed.
Action Plan Sample
- Goal: Increase sales by 10% in the next quarter.
- Resources needed: New marketing campaign, additional sales staff.
- Steps to take:
- Develop and launch a new marketing campaign.
- Hire additional sales staff.
- Train sales staff on a new marketing campaign.
- Track sales progress and make adjustments as needed.
- You could use data analysis to identify the most profitable products or services for your business.
This is just one example of a plan of action. The specific steps you need to take will vary depending on your goals and resources.
Data analysis can be a powerful tool for helping you achieve your goals. By using data analysis to understand your current situation and predict the future, you can make informed decisions that will help you reach your goals.
Step 7 - Implement your plan
You can use data analysis to implement your plan.
Descriptive statistics
This type of analysis summarizes data by providing measures of central tendency (e.g., mean, median, mode) and dispersion (e.g., range, standard deviation).
You could use descriptive statistics to track the number of customers you have acquired weekly.
Inferential statistics
This type of analysis uses data to make inferences about a population based on a sample.
Time series analysis
This type of analysis looks at how data changes over time.
Regression analysis
This type of analysis looks at the relationship between two or more variables.
Cluster analysis
This type of analysis groups data points together based on their similarity.
Decision tree analysis
This type of analysis uses a tree-like structure to show the relationships between different variables.
Step 8 - Monitor your plan using (KPI) key performance indicator
You can use data analysis to monitor your plan. This includes tracking your progress toward your goals and identifying areas where you need to make changes.
Many different types of data analysis can be used to monitor a plan. Some common types include:
Descriptive statistics
This type of analysis describes the data, such as the mean, median, and mode. This can help understand the overall trends in the data.
Inferential statistics
This type of analysis is used to make inferences about the population based on the sample data. This can be helpful in identifying areas where the plan is not working as well as expected.
Time series analysis
This type of analysis is used to study how the data changes over time. This can be helpful in identifying trends and patterns in the data.
Regression analysis
This type of analysis is used to determine the relationship between two or more variables. This can be helpful in identifying which variables are most important in predicting the outcome.
For example, if you are planning to launch a new product, you could use data analysis to track the following:
- The number of website visits to your product page
- The number of people who add your product to their cart
- The number of Customers who purchase your product
By tracking this data, you can identify areas where you need to change your plan, such as improving your website's design or increasing your marketing efforts.
Step 9 - Create a Backup Plan
You can use data analysis to create a backup plan by identifying potential risks and developing plans to mitigate those risks. Some types of data analysis that can be used for this include:
Statistical analysis
This can be used to identify trends and patterns in data that may indicate potential risks. For example, you could use statistical analysis to identify customer segments that are more likely to churn or products that are more likely to be returned.
Machine learning
This can be used to build models that can predict potential risks. For example, you could build a model that predicts which customers are most likely to churn or which products are most likely to be returned.
Text analysis
This can be used to identify risks that are mentioned in customer feedback or social media posts. For example, you could use text analysis to identify customer complaints about a particular product or service.
Once you have identified potential risks, you can develop plans to mitigate those risks. Some examples of mitigation plans include:
- Creating a contingency plan
This plan outlines what you will do in the event of a risk occurring. For example, if you have a contingency plan for a power outage, you will know what to do to keep your business running if the power goes out.
- Increasing security
This can be done by implementing security measures such as firewalls, intrusion detection systems, and data encryption.
- Buying insurance
This can protect you financially in the event of a risk occurring. For example, if you have insurance for your business, you will be reimbursed for any losses that you incur if your business is damaged or destroyed.
By using data analysis to create a backup plan, you can help to protect your business from potential risks.
Step 10 - Be patient
You can use data analysis to be patient. This includes understanding that it takes time to see results from your efforts and how they impact your business. This can help you stay motivated and on track, even when you don't see immediate results.
For example, you could track the number of website visitors, leads, and sales over time. This will help you see how your efforts are impacting your bottom line. You could also track the customer satisfaction rate over time. This will help you see how your efforts are impacting the customer experience.
Data analysis can be a powerful tool for staying patient and motivated. By tracking your progress, you can see how your efforts are impacting your business and stay on track to achieve your goals.
Here are some other types of data analysis that you can use in step 10:
Competitive analysis
This type of analysis can help you understand your competitors and how they are performing. This information can help you identify areas where you can improve your performance.
Market research
This type of analysis can help you understand your target market and its needs. This information can help you develop products and services that meet the needs of your target market.
Customer feedback
This type of analysis can help you understand what your customers think of your products and services. This information can help you improve your products and services and provide a better customer experience.
Employee feedback
This type of analysis can help you understand what your employees think of your company. This information can help you improve your company culture and create a more positive work environment.
By using data analysis throughout the process of optimizing your business, you can make informed decisions that will help you achieve your goals.
Key Takeaways
Data Analysis
Data Analysis and Process Automation as Pillars of Business Optimization
Data analysis helps identify trends and insights for better decision-making and increased profitability.
Process automation streamlines operations, reduces costs, and improves efficiency.
Benefits of Data Analysis in Business Optimization
Informed Decision-Making: Data-driven decisions are more accurate and less biased.
Identifying Opportunities: Data analysis uncovers the untapped potential for growth and improvements.
Customer Insights: Understanding customer behavior leads to personalized and targeted marketing.
Data Analysis Throughout the 10 Steps of Business Optimization
Set Clear Goals: Utilize data to identify target markets, understand competition, and track progress.
Gather Analytics: Use descriptive, diagnostic, and predictive analysis for website traffic, social media engagement, and sales.
Review Performance: Employ descriptive, diagnostic, and predictive analysis to assess performance and identify improvements.
Identify Waste: Use statistical analysis, process mining, value stream mapping, Six Sigma, and more.
Eliminate Waste: Apply data analysis to redesign processes, improve procedures, train employees, and invest in new equipment.
Create Plans to Achieve Goals: Use descriptive and predictive analysis to develop specific, measurable, achievable plans.
Implement Your Plan: Employ descriptive, diagnostic, and predictive analysis to track progress and make adjustments.
Monitor Your Plan Using KPIs: Analyze data to monitor progress and identify improvement areas.
Create a Backup Plan: Employ statistical, machine learning, and text analysis to identify and mitigate risks.
Be Patient: Use data analysis to understand that results take time and stay motivated towards achieving your goals.
For more insights on
business optimization and data analysis, visit
Primetivity Profit Therapy for Business
At Primetivity Solutions, we believe that your business deserves this edge. So, why not leap towards your business' brighter future today?
Contact us today, and let's begin this transformative journey together. Use the power of data to illuminate the path toward your business goals and beyond. Because with Primetivity, thriving isn't just possible—it's expected. Be proactive; choose
Primetivity. Let's redefine what success looks like together.
FAQs
Welcome to Primetivity's Data Analysis FAQ
Your go-to resource for all your data analysis questions!
What is data analysis, and why is it important for businesses?
Data analysis is the process of inspecting, cleaning, transforming, and modeling data to extract useful information, draw conclusions, and support decision-making. For businesses, data analysis is crucial as it empowers them to:
Make data-driven decisions based on facts and evidence.- Identify patterns, trends, and insights to optimize processes and performance.
- Gain a competitive edge by comprehending customer behavior and preferences.
- Improve efficiency and reduce operational costs by streamlining workflows.
- Enhance strategic planning and forecasting accuracy.
What types of data can be analyzed in business?
In the realm of business, various types of data can be analyzed, including:
Sales and Revenue Data
To understand sales trends, revenue growth, and customer buying patterns.
Customer Data
To profile customers, segment them, and personalize marketing strategies.
Financial Data
To analyze financial reports, cash flow, and profitability.
Operational Data
To optimize supply chain management, inventory control, and resource allocation.
Market Research Data
To gauge market trends, customer preferences, and competitive landscapes.
Social Media and Web Analytics Data
To measure online performance, engagement, and campaign effectiveness.
How can businesses ensure the accuracy of their data analysis?
Data accuracy is paramount in making reliable decisions. To ensure accurate data analysis, businesses should:
Data Cleaning
Regularly clean and preprocess data to remove duplicates, errors, and inconsistencies.
Data Validation
Implement validation checks to verify data integrity and flag any abnormalities.
Data Governance
Establish data governance policies to maintain data quality and security.
Cross-Check Results
Have multiple analysts cross-check the analysis results to minimize errors.
Stay Up-to-date
Keep abreast of data sources and ensure they are up-to-date and relevant.
What are the different data analysis techniques used in business?
Businesses use various data analysis techniques, such as:
Descriptive Analysis
Summing up data to obtain insights and understand patterns.
Diagnostic Analysis
Investigating data to determine the cause of specific outcomes.
Predictive Analysis
Predicting future events by analyzing past data.
Prescriptive Analysis
Recommending actions based on the results of predictive analysis.
Sentiment Analysis
Assessing customer sentiment from text data to gauge brand perception.
How can Primetivity help businesses with their data analysis needs?
At
Primetivity, we are passionate about data and its transformative power. Our expert team of data analysts and
consultants can:
Custom Solutions
Tailor data analysis solutions to meet your specific business objectives.
Data Visualization
Create compelling visualizations for easy data interpretation.
Insightful Reports
Generate comprehensive reports to extract actionable insights.
Data Training
Provide training sessions to enhance your team's data analysis skills.
Data Security
Ensure data privacy and security throughout the analysis process.
Feel free to contact us for any data analysis requirements, and our team will be delighted to assist you!